Campaign Manager - Campaign Manager (Silverlight)
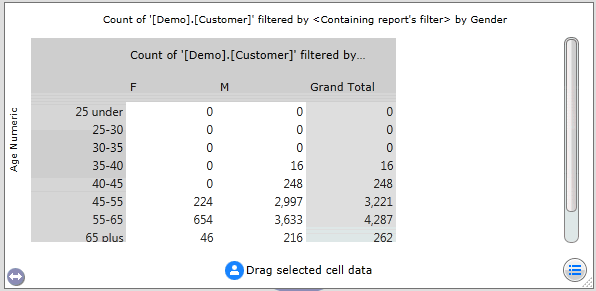
Crosstab Grid ToolThe Crosstab Grid tool shows the results of a cross tabulation report (a report that displays the joint distribution of two or more variables in a grid format). It is often used in conjunction with the chart tool, as both tools display the same information in different ways. You must configure at least one measure to be displayed on the grid, and can optionally add dimensions to be displayed on the rows and columns. For example, the grid below is configured to display a measure of the count of customers with an occupation of 'Director', broken down by age and gender dimensions:
|
| Online & Instructor-Led Courses | Training Videos | Webinar Recordings | ||

|
© Alterian. All Rights Reserved. | Privacy Policy | Legal Notice |   |