Campaign Manager - Campaign Manager (Silverlight)
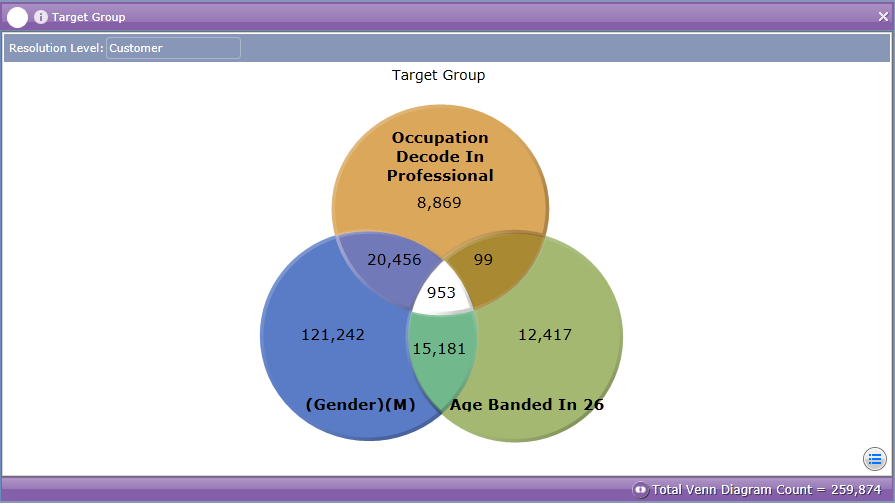
VennA Venn Diagram is a chart type that represents the intersection of up to four groups of records. Use Venn Diagrams to display key data segments in a visually striking manner. You can select any segment and drag it into the Document Bar for storage, or to be combined with another object. Hover the mouse over a segment to display a tooltip showing how it is calculated. You can use the settings to create a new Venn Diagram, specify the display settings including the colors used, and edit the data that is displayed. The following screen shot is an example of a Venn Diagram:
|
| Online & Instructor-Led Courses | Training Videos | Webinar Recordings | ||

|
© Alterian. All Rights Reserved. | Privacy Policy | Legal Notice |   |